How Indian Sellers Actually Photograph Ethnic Wear
We looked at 207,556 catalogue images made by 2,741 Indian sellers this year. Two things stood out. Seven in ten saree images need a second garment uploaded alongside them, which is the thing every general photo tool gets wrong. And 44 sellers produced 77% of everything, which says something uncomfortable about who this market is actually for.
207,556
catalogue images
2,741
Indian sellers
74%
were sarees
77%
from 44 sellers
What we found
- 1A saree is two garments. 69.2% of saree jobs include a blouse uploaded separately.
- 244 sellers produced 77% of all images. The market is far more concentrated than it looks.
- 3Saturday is a full working day; Sunday drops 76%. The six-day textile week, in the logs.
- 4Sellers keep roughly one image in three. Iteration is the workflow, not a failure of it.
- 5Sellers work on desktop (84.3%) even though Indian ecommerce browsing is overwhelmingly mobile.
- 6One seller in eight switches the interface to Hindi.
- 7Almost nobody generates square images. Sellers make one tall master and crop it.
- 8Video gets the marketing attention, but 96.6% of sellers are still working on stills.
Method, and what this data is not
Everything here comes from SareeViz usage between 1 January and 13 August 2026: 122,512 generation requests from 2,741 sellers, producing 207,556 images. Every figure below is a direct count, not an estimate or a projection.
That 2,741 is the number of sellers who generated something inside this window, not the size of our seller base. The base is larger and keeps growing, which is why other pages on this site quote a bigger number. Treat every figure here as a snapshot of the seven and a half months studied.
The honest limitation: these are sellers who chose a tool built for ethnic wear, so the garment mix is skewed towards ethnic wear by construction. The category split tells you what our sellers photograph, not what all Indian sellers photograph. The findings about how sellers work within ethnic wear are the part that generalises. We flag which is which as we go.
August is a partial month, 13 days, so it is excluded from the trend chart rather than shown as a decline.
The market is growing, and the growth is not seasonal noise
Generation volume grew 3.5x between January and July. Active sellers grew too, from 336 to 568, but not nearly as fast. The gap between those two lines is the real story: existing sellers are generating far more than they used to. Volume per active seller roughly doubled over the same period.
That pattern is what adoption looks like when a tool moves from experiment to production. Sellers do not try it on a few designs and stop. They try it, and then it becomes how the catalogue gets made.
44 sellers produced 77% of everything
This was the most surprising number in the dataset. Grouping every seller by how many generations they ran:
| Catalogue size | Sellers | Share of all images |
|---|---|---|
| 1 generation | 703 | 0.6% |
| 2 to 5 | 1,667 | 5.4% |
| 6 to 20 | 166 | 1.5% |
| 21 to 100 | 94 | 3.6% |
| 101 to 500 | 67 | 12% |
| 500 or more | 44 | 77% |
44 sellers, 1.6% of the total, account for 77% of all images generated. They average over 2,100 generations each. Meanwhile 2,370 sellers, 86% of the base, generated five images or fewer and contributed about 6% between them.
This is a sharper power law than we expected, and it reframes what the product is for. The heavy users are not hobbyists or small boutiques. They are manufacturers and wholesalers listing hundreds of designs a season, for whom catalogue photography is a recurring production cost rather than an occasional project. It is the same economics we worked through in our guide to AI photoshoots for clothing brands: the savings only become structural once the catalogue is large. The long tail is people trying it once.
If you are building anything for this market, the implication is uncomfortable but useful: the median user and the economically important user are almost completely different people, and designing for the median will lose you the business that matters.
What gets photographed
Sarees are three quarters of everything. Sarees, salwar suits, lehengas and kurtis together are over 92%. This is the part of the data most shaped by who chose our tool, so read it as a description of ethnic wear sellers rather than of Indian ecommerce. It is also why we built saree photography as the core of the product rather than one category among many.
The non-ethnic categories in the table are small enough that we would not draw conclusions from them either way. A low share here reflects who found us and what we have marketed, not what Indian sellers want. We also support jewellery photography and cover it in our guide to AI jewellery photography tools.
The finding that matters: a saree is two garments
This is the number worth taking away. Across 90,632 saree generations:
69.2% of saree images include a blouse uploaded as a separate file. That single number explains why general product photography tools fail on ethnic wear, and why our saree guide tells you to upload the blouse as its own photo.
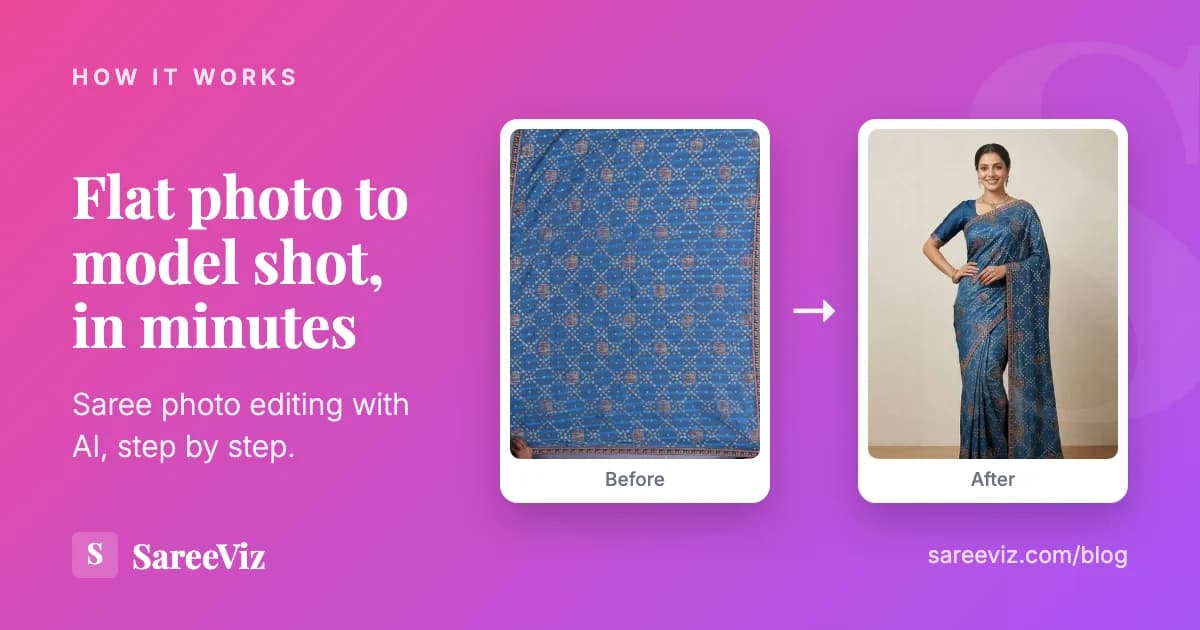
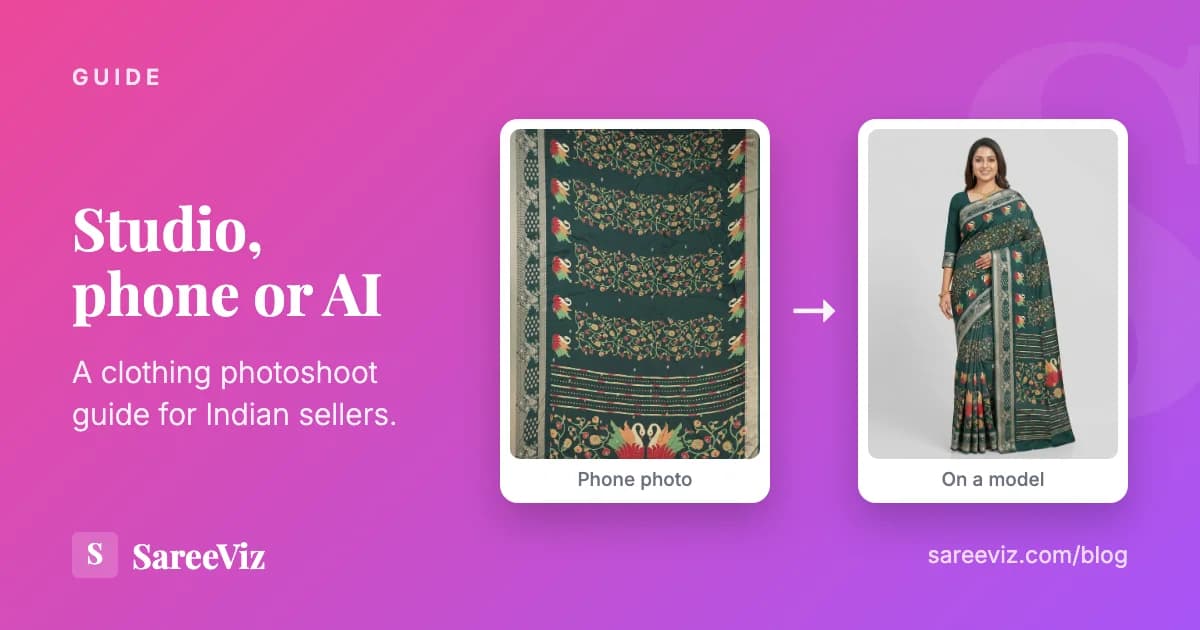
A saree is not sold as one item. It ships as six metres of drape fabric plus a blouse piece, often in a contrasting or matching fabric, sometimes unstitched. The seller photographs them separately because they arrive separately. To produce a listing image, both have to be understood as parts of one outfit, matched for colour, and assembled correctly on a body.
A tool built for a t-shirt has no concept of this. It sees one image, one garment. Feed it a saree and it will either ignore the blouse or treat it as a second unrelated product. This is not a quality gap that a better model fixes. It is a modelling gap about what the product is. We wrote about the mechanics in our guide to saree draping software.
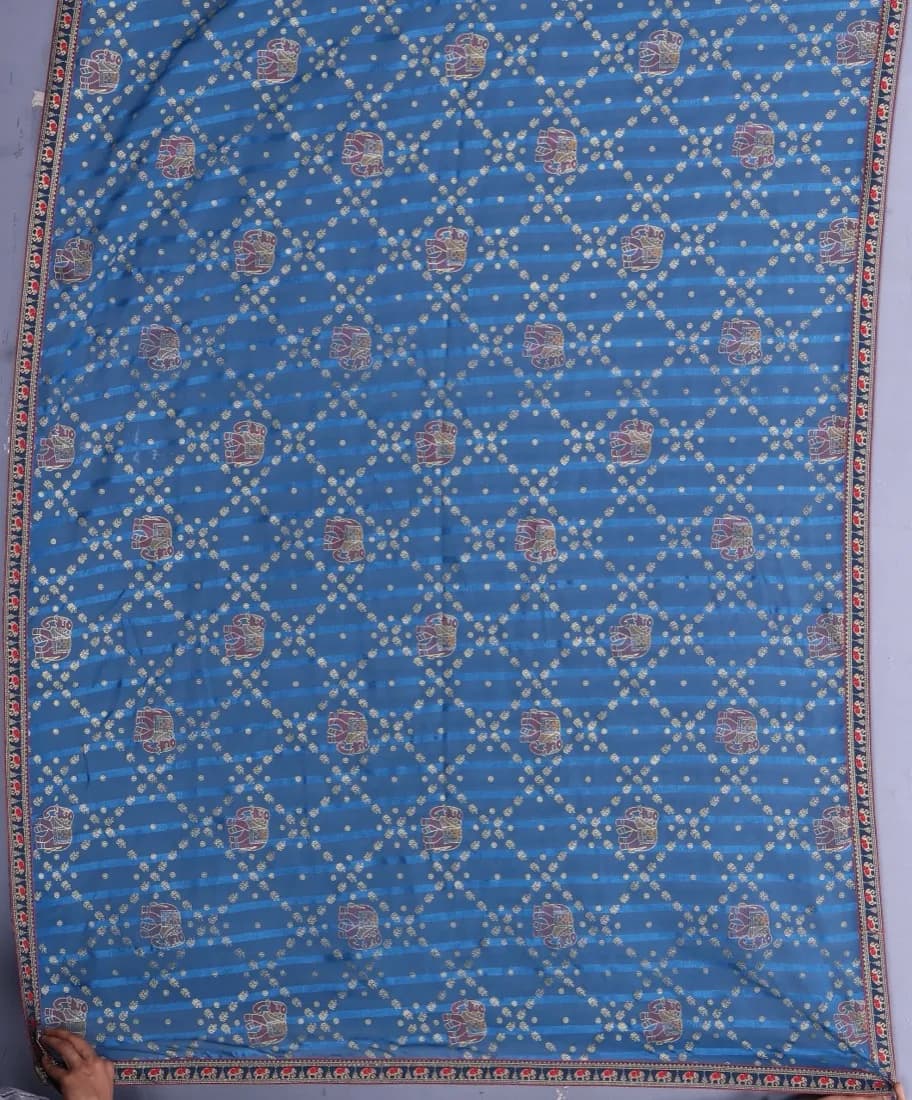
What the seller uploads
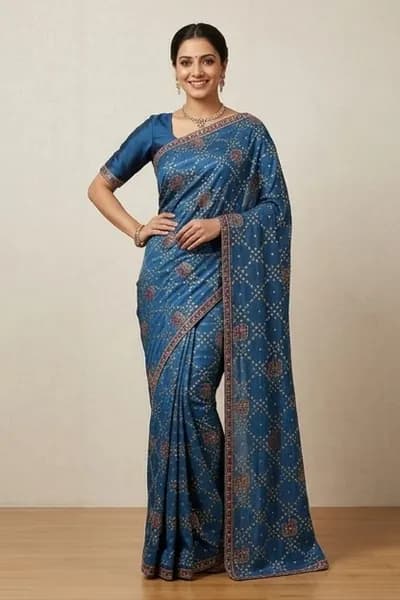
What the listing needs
The other numbers support the same picture. 65.4% of sellers write specific instructions rather than accepting a default, and 42.4% supply a reference model. These are not casual users experimenting. They know what the listing needs to look like and they are directing towards it.
One that surprised us: only 16.7% ask for multiple poses. The industry assumption is that sellers want variety. In practice most want one good image they can list, then they move on to the next design. When your catalogue is 400 designs deep, one usable image each beats six options for one design. For the sellers who do want variety, our pose guide shows every pose on a single design so the differences are actually comparable.
Different garments, different habits
Saree behaviour is not universal. Comparing the five largest apparel categories:
| Garment | Model ref | Instructions | Multi-pose | Images/job |
|---|---|---|---|---|
| Saree | 42.4% | 65.4% | 16.7% | 1.74 |
| Salwar suit | 50.8% | 73.3% | 21.7% | 1.77 |
| Kurti | 51.0% | 49.3% | 35.1% | 1.89 |
| Women's dress | 43.8% | 63.0% | 23.6% | 1.64 |
| Lehenga | 19.0% | 71.1% | 5.3% | 1.13 |
Two contrasts stand out. Kurti sellers request multiple poses at 35.1%, more than double the saree rate, and supply reference models most often. Kurtis are a fashion item bought on how they look worn, so variety earns its keep.
Lehenga sellers are the opposite on almost every measure: the lowest use of reference models at 19%, the lowest multi-pose rate at 5.3%, and the fewest images per job at 1.13. Lehengas are high-value occasion wear, often made to order. The seller wants one authoritative image of an expensive garment, not a spread of options.
The practical read: how much variety a catalogue needs is a function of the garment and its price point, not of the seller's sophistication.
Nobody is generating square images
Sellers pick the output format themselves, and they pick tall.
- 74.6% choose 4K at 2:3, a tall portrait format
- 12.6% choose 4K at 3:4, also portrait
- 90.8% choose 4K resolution over the 1K and 2K options
- Square 1:1 barely registers
It looks like a puzzle until you read the rules. Meesho publishes no rule on shape, background or pixel size, only that the front of the product is clear and carries no logo or watermark, and its live saree listings mix square, 4:5 and 2:3. So sellers are not defying a rule. They generate tall portraits at maximum resolution and, presumably, crop. It suggests they are producing one master image per design and cutting it for each destination, rather than generating separately per marketplace. Portrait also flatters a full-length garment and suits Instagram and WhatsApp catalogues, which are where a lot of Indian ethnic wear actually sells. That one-master-per-design habit is the workflow we price out in what a catalogue photoshoot costs per design, 50 designs at three attempts each against a studio quote.
The near-universal preference for 4K is easier to read: sellers would rather have more pixels than they need than discover later that they cannot crop or zoom. Storage is cheap; a reshoot is not. Our clothing photoshoot guide covers the marketplace specs in more detail, and the ecommerce photography page lists the formats we output.
Sellers browse on mobile and work on desktop
84.3%
of generations on desktop
15.7%
on mobile
Indian ecommerce is a mobile-first market by almost every published measure, and our own advertising data agrees: most clicks arrive from phones. But catalogue production is overwhelmingly a desktop activity. 1,644 sellers generated from a desktop against 1,181 from mobile, and desktop users generated more than five times the volume.
The reason is not mysterious once you picture the work. Catalogue production means managing files, uploading several images per design, checking results at full size and downloading in bulk. That is desk work. Discovering a tool happens on a phone during a spare minute; using it properly happens at a computer.
Anyone selling software to Indian sellers should hold both facts at once. A mobile-only experience will be discovered and abandoned. A desktop-only one will never be discovered at all.
The six-day week is alive and well
Timestamps converted to IST, generations by day of week:
Saturday is a full working day. Sunday is not. Monday through Saturday sit within a few percent of each other, between 18,815 and 20,589 generations. Sunday drops to 4,618, a fall of about 76%.
This is the six-day week of the Indian textile trade showing up in software logs. Surat's wholesale markets run Monday to Saturday, and catalogue production follows the market, not the Western working week. If you are scheduling anything that touches these sellers, a Saturday campaign will land and a Sunday one will not.
And the working day is long
Work starts around 10am, climbs through the morning, and peaks at 3pm. Roughly three quarters of all generations happen between 11am and 7pm. The curve then tails off slowly rather than stopping, and there is a small but real band of activity after midnight.
The afternoon peak rather than a morning one is worth noting. Catalogue work appears to be something sellers turn to once the day's trading is under way, not the first task of the morning.
One keeper in three attempts
Among sellers who both generate and download, the average is 168 generation jobs and 55 downloads. Roughly one job in three produces an image the seller takes away and lists.
We think that is the most useful accuracy number we can publish, because it is a behavioural measure rather than a claim. Nobody is scoring the output against a rubric; a working seller with a catalogue to fill is deciding whether an image is good enough to put in front of buyers, and one in three clears that bar.
Set against the alternative, that ratio is what makes catalogue-scale production possible. Three attempts to a usable image is a few minutes. Three attempts at a studio is three shoots.
For completeness, the technical failure rate is separate and small: 5,911 errors against 127,766 attempts, about 4.6%. The two-in-three that do not get downloaded are overwhelmingly successful generations the seller simply did not pick.
Caveat worth stating: this counts downloads we can observe. Sellers who take images out through another route would not appear here, so treat one-in-three as a floor on the keep rate rather than an exact figure.
Language is an accessibility problem
324 sellers, close to one in eight, switched the interface to Hindi. That is not a rounding error, and it is a group an English-only product would have quietly excluded.
It is easy to assume that anyone running an online catalogue operates comfortably in English. At the scale these sellers work, that assumption is wrong often enough to matter. The people uploading four hundred designs a season are traders and manufacturers first; English is a tool they may or may not prefer to work in, and for one in eight it is a barrier worth clicking away.
Worth saying plainly: this is an access question, not a preference question. A seller who cannot read the interface confidently is not a seller with a slightly worse experience, they are a seller who does not start.
The gap this points at is regional languages beyond Hindi. Gujarat is 53% of our sellers, and Gujarati is not currently an option. On this evidence, that is a real hole rather than a nice-to-have.
Marketing talks about video; sellers are buying stills
Every marketplace is pushing short product video, and Meesho has been rolling out video on listings. In this data, 94 sellers have generated a video, producing 678 in total. Against 2,741 sellers and 207,556 images, that is about 3.4% of the seller base.
The gap between what the category markets and what sellers actually reach for is the finding. Video is the headline feature in almost every launch announcement, ours included. The demand sitting underneath it is still overwhelmingly for still photographs, because that is what a listing needs before it needs anything else.
When a catalogue of four hundred designs still has no photographs, video is next year's problem. Anyone deciding where to put effort in this market should weight stills accordingly.
Where the sellers are
| State | Sellers | Generations |
|---|---|---|
| Gujarat | 1,450 | 80,138 |
| Maharashtra | 359 | 7,917 |
| Delhi | 224 | 5,994 |
| Karnataka | 149 | 1,173 |
| Uttar Pradesh | 93 | 1,431 |
| West Bengal | 78 | 2,302 |
| Madhya Pradesh | 44 | 4,754 |
Gujarat is 53% of sellers and 65% of generations. Surat is the centre of India's saree manufacturing and wholesale trade, so the concentration is not surprising. What is interesting is the gap between those two figures: Gujarat sellers run visibly larger catalogues than sellers elsewhere, which fits the picture of manufacturers rather than resellers.
Madhya Pradesh is the outlier worth noting. 44 sellers produced 4,754 generations, roughly 108 each, against a national average of 45. A small number of large operations rather than many small ones. Karnataka shows the opposite shape: 149 sellers, the fourth-largest count, but about eight generations each.
What we would take from this
- Ethnic wear is not a subcategory of apparel photography. The two-garment structure of a saree is a different problem, not a harder version of the same one.
- The market is concentrated in a way category numbers hide. 1.6% of sellers are 77% of the work. Median-user thinking will point you at the wrong product.
- Sellers are not passive. Two thirds write specific instructions. Tools that assume a one-click user are solving for someone who is not there.
- Volume beats variety, except where it does not. Sarees and lehengas want one good image; kurtis want options. The garment decides.
- Mobile-first discovery, desktop-first work. Both are true and they need different surfaces.
- Build for the six-day week. Saturday is a working day and Sunday is not. Anything scheduled on a Western calendar will miss.
- One usable image per three attempts is the working standard. Sellers reach a keeper quickly, which is what makes catalogue-scale production possible at all.
- Language is an accessibility question, not a nice-to-have. One seller in eight chose Hindi, and regional languages beyond it are untested.
- Stills come first. Video gets the marketing attention, but the overwhelming majority of catalogue work is still photographs.
Frequently asked questions
Where does this data come from?
It comes from SareeViz usage between 1 January and 13 August 2026: 122,512 generation requests from 2,741 sellers, producing 207,556 catalogue images. It covers sellers who use our tool, so it is a large sample of a specific population rather than a survey of all Indian sellers. We have tried to be clear throughout about what that does and does not support.
Why do so many saree images include a separate blouse upload?
Because a saree is not one garment. It is sold as a saree with an unstitched or stitched blouse piece, and the two are usually photographed separately because they arrive separately. To make a listing image, both have to be understood as parts of one outfit and assembled on a body. A tool built for a single flat garment cannot represent what is actually being sold.
Is it normal for so few sellers to produce most of the images?
The concentration surprised us, but it is consistent with how Indian ethnic wear wholesale works. 44 sellers produced 77% of all generations. These are manufacturers and wholesalers listing hundreds of designs a season, not boutiques listing a handful. The long tail of 2,370 sellers who generated five images or fewer contributed about 6% of volume between them.
Why is Gujarat so dominant in the data?
Surat is the centre of India's saree manufacturing and wholesale trade, so a large share of the country's saree sellers are concentrated there. Gujarat accounts for 53% of the sellers in this data but 65% of the images, which suggests sellers there run larger catalogues than sellers elsewhere.
Does this tell me what all Indian ecommerce sellers do?
No, and it is worth being direct about that. These are sellers who chose a tool built for ethnic wear, so the garment mix is skewed towards ethnic wear by construction. The findings about how sellers work within ethnic wear are the reliable part. The findings about category share describe our sellers, not the whole market.
What does "sellers keep one image in three" actually mean?
Among sellers who both generate and download, the average is 168 generation jobs against 55 downloads. So roughly one job in three ends with the seller taking an image away. This is not a failure rate: the technical error rate is separate and small, about 4.6%. The other two are successful images the seller simply did not choose. It reflects a workflow where retries are cheap enough to be worth making.
Why does Sunday matter?
Because it shows the working calendar these sellers actually keep. Monday to Saturday are all within a few percent of each other, and Sunday falls about 76%. That is the six-day week of the Indian textile trade, where Surat's wholesale markets run Monday to Saturday. Anything scheduled against a five-day Western week will miss a full working day and land on a dead one.
Can I cite this data?
Yes. Please link to this page so readers can see the method and the caveats. If you need a cut of the data we have not published, write to us and we will see what we can share.
Using this data
You are welcome to cite any figure here. Please link back to this page so readers can see the method and the caveats. If you need a cut we have not published, by state, by garment, by month, write to us and we will see what we can share.
Try it yourself
Built for the way ethnic wear actually works
Saree and blouse together, draping that behaves, and a catalogue image in about a minute.
Try SareeViz Free →